Track QR codes
In this article
QR Translator provides a powerful dashboard to help you understand how your QR codes are being used across languages, locations, and time.
Before you begin
QR Translator allows you to visualize how your QR codes are used worldwide:
- Where scans happen
- Which languages are used
- When users access your content
This helps you understand real-world usage, such as:
- What languages they prefer
- When customers actually use your product or service
- Where your audience is located
Scan data is only collected for activated QR codes (trial or subscription).
Where to find the scan data
- Open the project you want to view.

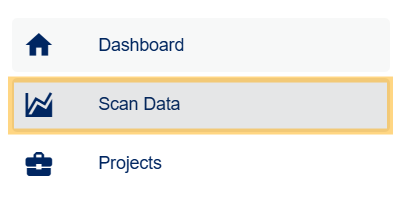
- From the side menu, click Scan Data
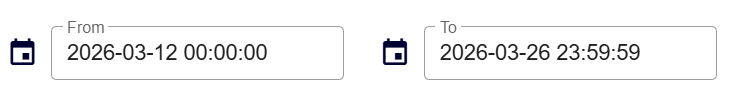
- Select a date range to load data for the entire project.
- To view data for specific QR codes only, use Filters to select the QR codes you want to include.
How to export data
- Each chart can be downloaded as CSV data (raw data) or as an image file (chart).

To download all data for the selected date range, click Export data next to the date range selector.
Viewing options
- You can click items in the legend to show or hide them on the chart.

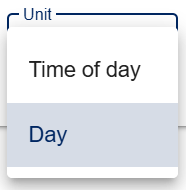
- Some charts have multiple viewing options shown as a dropdown menu.
Definitions
These definitions help you understand how each metric is counted, so you can read the charts more accurately.
- User
Users represent the number of unique browsers used to access your QR codes.
Repeated views from the same browser are counted as one user.
Using a different browser may be counted as a separate user. - Pageview
A pageview is counted each time a translation page is displayed in a browser.
This includes QR code scans, page reloads, and language changes. - Visit
A visit begins when a user scans a QR code. If the user opens another QR Translator page by clicking a link from that page, it is still considered the same visit. However, if the user scans another QR code directly (not via a link), a new visit will start.
What each chart shows
- Pageviews by Language
Shows the number and share of pageviews by language.
This helps you understand which translations are most used. For example, you may discover unexpected demand in certain languages. - Users & Pageviews by Hour / Day / Month
Displays scan trends over time. - Pageviews by Visit
Shows the number and share of visits where the user viewed 1 page, 2 pages, 3 pages, and so on.
Example:- A user scans the QR code on a department store map → 1 pageview
- The user switches to another language → 2 pageviews
- They click a link to the 1st Floor Guide → 3 pageviews
- Then click a link to the 2nd Floor Guide → 4 pageviews
- Pageviews and Language Distribution by QR Code
This graph compares performance across multiple QR codes by displaying the pageviews for each QR code.
It also shows the number of times each translation was viewed.
Up to 200 QR codes can be displayed. - Pageviews by Time of Day & Day of Week
Shows when pageviews occur within the selected period.
You can switch between time of day and day of the week. - Pageviews by Device (Browser) Language
Displays the language setting of users’ browsers.
The main chart shows pageviews grouped by the primary language of the user’s browser (e.g., “en” for English).
This reflects browser language settings, not the actual displayed tranlation.
The smaller chart provides a more detailed breakdown of language variants (e.g., “en-AU”, “en-GB”).
Hover over or click a language in the main chart to view its detailed breakdown. Click elsewhere to reset. - Views by OS / Browser
This chart shows the share of pageviews by operating system (e.g., iOS, Android, Windows) and web browsers (e.g., Chrome, Safari, Firefox). - Views by Region
This chart shows the share of pageviews by region, based on the location of the device at the time the QR code was scanned.
In this chart, the selected date range applies only to the start and end dates; hours and minutes are not taken into account.
ℹ️ For Views by OS / Browser and Views by Region:
- Regardless of the selected date range, data is displayed available for up to 13 months.
- The selected date range applies only to the start and end dates; hours and minutes are not taken into account.
Was this helpful?
YesNo